Marimo Notebook Tutorial
In this tutorial we will build a simple web app with Marimo to explore Komodo RX Data
Step 1: Create environment
Section titled “Step 1: Create environment”Create and change into a new directory:
mkdir komodo-rx-data-explorercd komodo-rx-data-explorerThen, initialize a new uv project:
uv init --python "python >=3.11, <3.14"Add the Komodo SDK package:
uv add komodoFinally add 3rd party dependencies to the project:
uv add marimo polars pandas altairStep 2: Login and set your account
Section titled “Step 2: Login and set your account”uv run komodo loginThis will start the OAuth flow and store your JWT and refresh token.
uv run komodo account setStep 3: Download the Notebook
Section titled “Step 3: Download the Notebook”Download the komodo_notebook.py marimo notebook and save it in the root of your project.
curl -o komodo_notebook.py https://docs.komodohealth.com/komodo_notebook.pyStep 4: Run Marimo
Section titled “Step 4: Run Marimo”uv run marimo edit komodo_notebook.pyThis will open the notebook in your browser
Step 5: Running the Notebook
Section titled “Step 5: Running the Notebook”-
Run the first 2 cells to list your available schemas.
-
Find your schema name (typically
PROD,DATA, orCOHORTS) and enter it in cell 3 to list tables. -
Locate the RX data table (contains
RXin the name, e.g.,T1_ALL_TX_CLAIMS_RX). -
Update the
SCHEMAandTABLEvariables in cell 4 with your values and run the cell. -
Run the remaining cells to generate the chart.
-
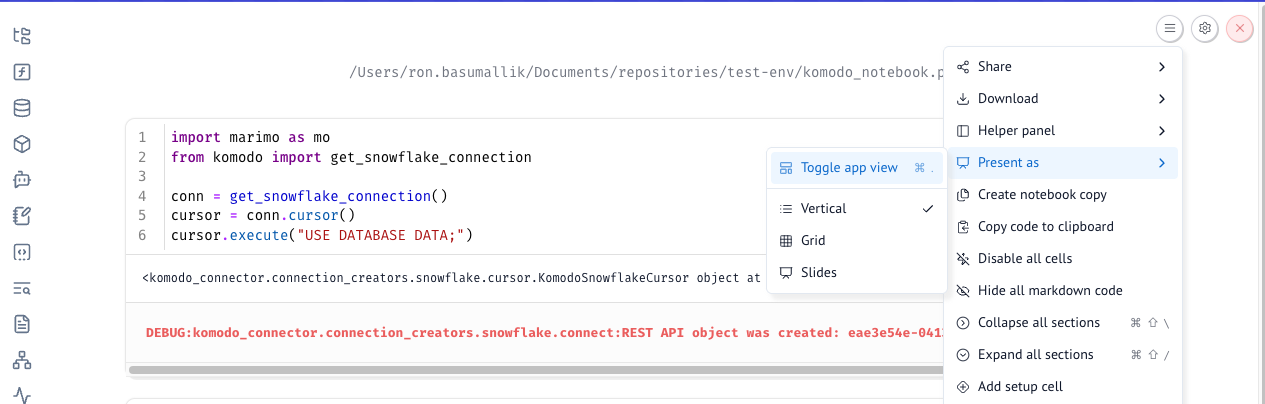
Enable app view and use the brand selector to explore different data views.
Congrats! You’ve built a simple web app with Marimo to explore Komodo RX Data.